Assignment #2: T-Tests with SPSS
In this assignment, we will elaborate on some of the examples we went through in class with larger datasets and will conduct each of the three types of t-tests using SPSS. Remember that I have posted the “T-test syntax cheat sheet” which is useful to have beside you. This sheet also describes what all the output represents.
Jump to Intro to T-test lecture and dataset from class.
Jump to Intro to T-test lecture and dataset from class.
TASK #1: One-sample t-test
Our shark researcher from the first day of class has been reading your notes, and has come up with a better experiment to test his shark-deterring beacon. Rather than testing the device in the wild (with many confounds), he has brought the study into the laboratory—the pool in his backyard. The pool has been setup so that the beacon is (randomly) placed at one end, and a light beam in the middle of the pool records when the shark switches from one side to the other to record preferences. So just like our preferential looking paradigm, he records the proportion of time the shark prefers the side of the pool with the beacon.
He abducts a random sample of 50 sharks from various beaches. Each shark is dropped into the pool for an hour, and the proportion of time spent in the beacon half of the pool is recorded. Since he has not yet tested the device, he uses a two-tailed (nondirectional) test. If the beacon is ineffective, he expects the sharks to spend on average half of their time in the beacon half of the pool.
Download his data file and read it into SPSS
https://www.dropbox.com/s/37nvpc8zdu2p14v/Assign2a.txt?dl=0
Next, we will conduct a one-sample t-test to determine if the mean of his sample differs from the mean expected under the null hypothesis (0.5):
T-TEST TESTVAL = 0.5 /VARIABLE = score.
- State the researcher’s null and alternate hypotheses.
- What proportion of time did the sample of sharks spend in the beacon end of the pool?
- What decision should the researcher make regarding his hypotheses?
- Write a brief conclusion statement for our researcher.
TASK #2: Independent samples t-test
Recall Posner and Mitchell’s (1967) matching task from class. We have conducted an experiment in which subjects judge as quickly as possible whether two simultaneously presented letters are the same or different. The subjects are randomly assigned to two groups, and instructions for “same” are varied between groups. For the physical matching group, the instructions are to respond “same” if the two letters are physically identical (e.g., AA, or aa) but different otherwise (e.g., AF or Aa). For the name matching group, the instructions are to respond “same” if the two letters have the same name (e.g., AA, aa, Aa) but different otherwise (e.g., AF, Ae). We are interested in whether there is a mean difference in time to respond “same” between the two groups, which would imply a temporal hierarchy of processing:
Recall Posner and Mitchell’s (1967) matching task from class. We have conducted an experiment in which subjects judge as quickly as possible whether two simultaneously presented letters are the same or different. The subjects are randomly assigned to two groups, and instructions for “same” are varied between groups. For the physical matching group, the instructions are to respond “same” if the two letters are physically identical (e.g., AA, or aa) but different otherwise (e.g., AF or Aa). For the name matching group, the instructions are to respond “same” if the two letters have the same name (e.g., AA, aa, Aa) but different otherwise (e.g., AF, Ae). We are interested in whether there is a mean difference in time to respond “same” between the two groups, which would imply a temporal hierarchy of processing:
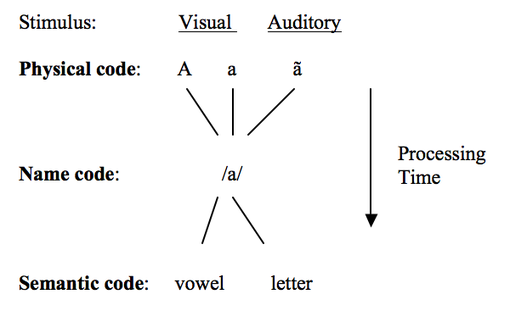
Our hypothesis is that it will take longer to respond same under name matching instructions than physical matching because it takes time to translate from a physical image to an abstract category.
Download the data file and read it into SPSS:
https://www.dropbox.com/s/ayxhsn6zuvkohhu/Assign2b.txt?dl=0
The first score represents the subject’s group code (1=physical match, 2=name match), and the second score is the subject's mean time to respond same. Using the value labels command, give text labels to the group code so your output says “Physical match” and “Name match” rather than 1, 2. Next, we will conduct an independent samples t-test:
T-TEST /GROUPS = group (1,2) /VARIABLE = rt.
"group" here should be your name for the grouping variable, and "rt" should be your name for the dependent variable.
In the second table, the only values you care about right now are t, df, and Sig. (2-tailed).
- State our null and alternate hypotheses.
- What was the mean RT for each group?
- What decision should we make regarding our hypotheses?
- Write a brief conclusion statement.
TASK #3: Paired-samples t-test
Dr. S. Mantic is interested in the cocktail party effect in visual word recognition. When at a party, all the conversations taking place around you seem garbled, but you have no problem attending to the conversation you are participating in. However, when your name is mentioned in one of the garbled neighboring conversations you are not attending to, you automatically identify it (and want to know who’s talking about you). This effect is a type of “popout” effect in attention and has been used to argue for parallel vs. serial theories of attentional processing.
Since Dr. Mantic is interested in visual word identification, she modifies the classic Stroop paradigm and creates a list with two types of words. The first type are neutral words, for which she uses names of furniture (e.g., CHAIR, TABLE), and the second type are personal words, for which she uses personal names of each participant (e.g., the participant’s name, favorite pet’s name, etc.). Thus, each participant has a list custom made for him/her. The task is simply to name the color of the ink each word is printed in, but her hypothesis is that this will produce more errors in the personal condition b/c the participant cannot ignore the automatically processed personal words.
You can find a text file with her data at: https://www.dropbox.com/s/jvugs3kzhea7aou/Assign2c.txt?dl=0
Each row is a participant. The first column is number of errors made in the neutral condition, and the second column is number of errors made in the personal condition. Dr. Mantic hypothesizes that mean errors will be greater in the personal condition than the neutral condition. Since each participant sees both types of words, she uses a paired-samples t-test to analyze the data:
T-TEST /PAIRS = personal neutral.
Print out your answers to the questions, syntax, and output (do NOT print out your data files).
Dr. S. Mantic is interested in the cocktail party effect in visual word recognition. When at a party, all the conversations taking place around you seem garbled, but you have no problem attending to the conversation you are participating in. However, when your name is mentioned in one of the garbled neighboring conversations you are not attending to, you automatically identify it (and want to know who’s talking about you). This effect is a type of “popout” effect in attention and has been used to argue for parallel vs. serial theories of attentional processing.
Since Dr. Mantic is interested in visual word identification, she modifies the classic Stroop paradigm and creates a list with two types of words. The first type are neutral words, for which she uses names of furniture (e.g., CHAIR, TABLE), and the second type are personal words, for which she uses personal names of each participant (e.g., the participant’s name, favorite pet’s name, etc.). Thus, each participant has a list custom made for him/her. The task is simply to name the color of the ink each word is printed in, but her hypothesis is that this will produce more errors in the personal condition b/c the participant cannot ignore the automatically processed personal words.
You can find a text file with her data at: https://www.dropbox.com/s/jvugs3kzhea7aou/Assign2c.txt?dl=0
Each row is a participant. The first column is number of errors made in the neutral condition, and the second column is number of errors made in the personal condition. Dr. Mantic hypothesizes that mean errors will be greater in the personal condition than the neutral condition. Since each participant sees both types of words, she uses a paired-samples t-test to analyze the data:
T-TEST /PAIRS = personal neutral.
- State Dr. Mantic’s null and alternate hypotheses.
- Perform a paired-samples t-test on the error data to test her hypothesis.
- Write a brief results statement for the hypothesis. Are there any flaws with this experiment?
Print out your answers to the questions, syntax, and output (do NOT print out your data files).
